
Tongkat Ali Extracts | Everything You Need To Know Before You Buy
WHAT IS TONGKAT ALI?
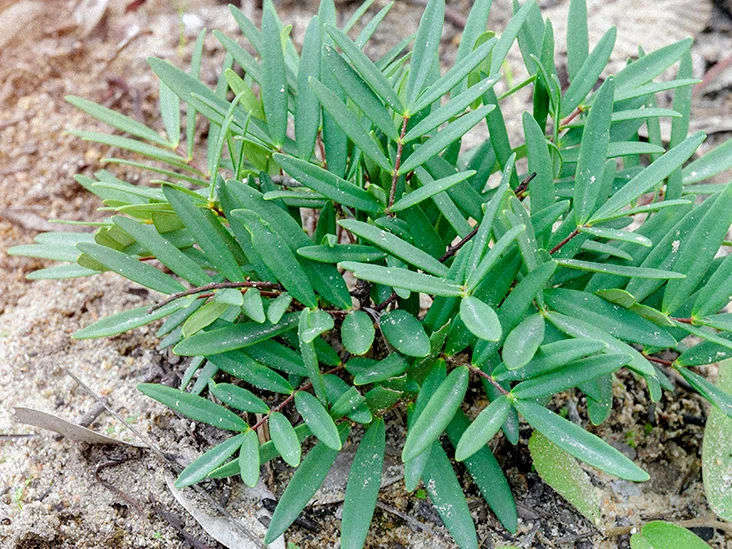
Eurycoma longifolia, more commonly known as Tongkat Ali or Longjack, is an evergreen plant native to Southeast Asia. Eurycoma longifolia forms a large root system underground which produces a plethora of potent bioactive compounds! The main class of compounds produced by Eurycoma longifolia root are the Quassinoids. Within this class, the most bioactive Quassinoid is a compound called Eurycomanone. The bulk of Tongkat Ali benefits are attributed to it.This is why it is important to look for Eurycoma longifolia extracts that are high in Eurycomanone! We’ll touch more on this later, but first let’s explore the history of Tongkat Ali supplementation.
WHERE IS TONGKAT ALI MOST COMMONLY USED?
The word Tongkat Ali translates to “Ali’s Walking Stick” in the Malay language. Tongkat Ali acquired this name due to its centuries-old use in Southeast Asia, particularly Malaysia, for boosting physical strength. Tongkat Ali is widely used, especially in countries like Malaysia, where Tongkat Ali-infused instant coffee is common in stores. These Tongkat Ali products are popular amongst men to help boost physical energy and strength! However, in the Western world, exploration of Tongkat Ali is just beginning, yet it’s steadily gaining popularity as a supplement.
WHAT YOU NEED TO KNOW ABOUT TONGKAT ALI SUPPLEMENT QUALITY
Many new companies are entering the market, aggressively marketing Tongkat Ali supplements as “testosterone boosters.” When a supplement gains rapid interest, quality often declines due to shortcuts taken in production. Companies often skip analytical testing, blindly trusting overseas suppliers, especially with Tongkat Ali supplements.
We dedicated significant time and effort to crafting a top-notch Tongkat Ali supplement and developing precise testing methods. In fact, the Tongkat Ali extracts we wanted did not exist. We partnered with an Asian extractor who follows our guidelines and sources roots from select Malaysian farms for extraction.
After over a year of research, sourcing, method development, and testing, we’ve launched two premium Tongkat Ali supplements. One of the Tongkat Ali supplements is standardized to 2% Eurycomanone. This extract is intended for general daily use, and is a good introduction to Tongkat Ali. Our other Tongkat Ali extract boasts a 10% Eurycomanone standardization, ranking it among the most potent available supplements! The 10% extract is intended for experienced athletes, or individuals looking for more pronounced and acute effects. The 2% extract, though seemingly less potent, still surpasses the majority of Tongkat Ali extracts on the market.
Noo-tropics.eu TONGKAT ALI VS. THE COMPETITION
Many Tongkat Ali extracts do not even standardize for the main bioactive compound, Eurycomanone. In fact, most Tongkat Ali extracts are marketed as 100:1 or 200:1 extracts. This typically translates to using 100-200 pounds of root material to produce just one pound of Tongkat Ali extract. Despite their high extract ratios, analytical testing revealed that the “100:1” and “200:1” extracts have relatively low Eurycomanone content. In a recent study, we tested 8 competitors, most claiming extract ratios of 100:1 or 200:1, along with one claiming 2% Eurycomanone standardization. Check out the table and image below for our testing results:
| VENDOR | EXTRACT RATIO | EURYCOMANONE SPECIFICATION | TESTING RESULTS (EURYCOMANONE) |
| Noo-tropics.eu | Not Defined | 10.00% | 10.4% |
| Noo-tropics.eu | Not Defined | 2.00% | 2.05% |
| Competitor 1 | 100:1 | No Specification | 0.52% |
| Competitor 2 | Not Defined | 2.00% | 0.43% |
| Competitor 3 | 100:1 | No Specification | 0.24% |
| Competitor 4 | 100:1 | No Specification | 0.23% |
| Competitor 5 | Not Defined | No Specification | 0.10% |
| Competitor 6 | 200:1 | No Specification | *Not Detected |
| Competitor 7 | Not Defined | No Specification | *Not Detected |
| Competitor 8 | 200:1 | No Specification | *Not Detected |
Method Detection Limit 0.03%
Debunking Extract Ratios:
The Eurycomanone content of the 100:1 extracts varied, with competitor number 1 reaching the highest at only 0.53%. The highest testing 100:1 extract was still about 4 times less potent than our 2% Eurycomanone extract. So, what about the 200:1 extracts? Surely those should be coming pretty close to our 2% Tongkat Ali extracts, right? The opposite appears to be true, as the 200:1 extracts appear to take a turn for the worse!
They give the illusion of potency based on claimed ratios, but practically contain no Eurycomanone! None of the 200:1 extracts that we tested were able to hit our detection limit of 0.03% Eurycomanone on HPTLC. This means that if they contain any Eurycomanone at all, it is below our machine’s detection limit.
Exposing Misleading Extract Claims:
After consulting with our most trusted suppliers, it became evident that these high extract ratios are indeed fake. Multiple suppliers admitted to us that the 100:1 and 200:1 extract ratios are completely made up. They are fake! US vendors began labeling their extracts as 100:1 and 200:1 to appear more potent, although they were far from it. The 100:1 extracts arecloser to a 4:1, and the 200:1 extracts are around 5:1. Often times they are even lower than that, because you can’t verify extract ratios in the lab. Extract ratios for Tongkat Ali can be easily manipulated, leading to significant variability in products with the “same ratio.”
The 200:1 extracts we tested did not appear to be extracted at all, possibly just plain root material. These extract ratios pose a challenge in verifying if a Tongkat Ali extract is truly as labeled. We shifted our focus from ambiguous extract ratios to accurately testing for Eurycomanone content.
Questioning Label Claims:
Several vendors are now standardizing for Eurycomanone content. We tested one claiming to match our 2% Eurycomanone extract specification. This vendor is listed as competitor number 2 in the table above. The extract did not come close to containing the claimed 2% Eurycomanone, as shown in the table. Thus, even if a vendor is claiming a Eurycomanone percentage, this does not necessarily mean this number is correct. This is because most vendors blindly trust their suppliers and do not conduct any analytical testing themselves. So we have false and misleading extract ratios, and we have products coming in way lower than their label claims. Unfortunately, this is the state of the Tongkat Ali market at the moment.
After seeing all of these tests, we decided we needed to bring a quality Tongkat Ali supplement to the Nootropics community! As you can see from the table above, our Tongkat Ali extracts test very accurately. In the case of the 10% Eurycomanone extract, we are even over by 0.4%! Better yet, we perform a whole lot more analysis on our Tongkat Ali including:
⦁ Species and plant part identity testing by HP-TLC
⦁ Loss on drying by moisture balance
⦁ Heavy metal testing by ICPMS
⦁ Microbial proliferation by water activity
A DEEP DIVE INTO HPTLC TESTING
Testing Methodology for Eurycomanone Percentages
Wondering how we determined Eurycomanone percentages? Did we really test competitors? Let’s delve into the testing methodology. We prioritize transparency in the supplement industry. Let’s review the testing methodology and analytical test results. It is complex, but also very interesting to dive into!
High-performance Thin-layer Chromatography (HPTLC) Testing
Testing Tongkat Ali involves High-performance thin-layer chromatography (HPTLC). Unlike HPLC, it employs TLC plates for compound separation. At its most basic, we have developed methods to dissolve all of the compounds in the Tongkat Ali samples into a solvent. We then spray this solvent onto a plate made of specialized silica gel. The compounds then travel up the TLC plate by means of capillary action.
The separation occurring on the TLC plate is very similar to the separation happening in an HPLC column, like a C18. C18 stands for octadecylsilane, or 18 carbons bound to silicon dioxide. These silica-bound carbons stick out into the column and separate molecules from each other as they are pumped by at high pressures. In a TLC plate, you are essentially flattening out the column, and having the separation occur under normal air pressure, rather than being pumped at high pressure through a column. This capillary action is what spreads the different molecules across the plate, and separates them based on their polarity, which allows us to both identify and quantify each of the bands on the TLC plate.
Understanding Capillary Action
If you want to see capillary action for yourself, find yourself some food coloring and put it in water. Now, take a piece of paper towel, and dip it into the food coloring solution, and slowly but surely you will see the colored liquid moving up into the paper towel. In the context of HPTLC, this capillary action separates the different compounds in Tongkat Ali by their polarity. Based on their polarity, different compounds in Tongkat Ali will travel up the TLC plates at different rates. This variation in how the various compounds in Tongkat Ali travel up the TLC plate is what separates the compounds from each other. This means that they will be deposited at different positions on the TLC plates. This may sound a little bit vague right now, but it is about to make a whole lot more sense because we can visualize it!
Visualizing Compounds on TLC Plates
Once our TLC plate is ready, we can actually visualize where the compounds are on the plate. We do this by exposing the plates to UV and visible light, typically ranging from 190nm to 900nm. In our case, we used two wavelengths: one at 254nm and the second at 366nm. When we hit the plates with these wavelengths, the compounds on the plate either fluoresce or prevent fluorescence, allowing us to visually see where they are on the plate. This is very similar to the UV detector on an HPLC. So you can see how an HPTLC and HPLC are doing the same thing, just using different methods to do it. It’s about chromatographic separation of molecules, then detection using a UV detector. Let’s take a look at the plate visualized with 254nm first:

Understanding Rf Values and TLC Plates
All of the dark spots you see are where the compounds ended up due to the capillary action. The scale on the vertical axis are Rf values. An Rf value is the ratio of distance the compound travels on the TLC plate to the distance traveled by the solvent the compound is dissolved in. The Rf value then falls between 0 and 1. To simplify it, imagine you and three friends are doing a one-mile running race with a time limit of 9 minutes.
At the end of 9 minutes, your experienced running friend made it all the way to the one-mile mark, whereas your other friends were scattered between 0.1 miles and 0.5 miles. One of your friends twisted his ankle at the 0.1 mile mark and didn’t make it much further. Another friend was pretty slow and could only make it to the 0.5-mile mark. You are also an experienced runner and tied with your friend at the 1-mile mark. These mile marks can be seen as Rf values, and these Rf values are being visualized on the TLC plate above.
Reference Standards and Quantification
If you check out the columns labeled 1 on the left, you can see those are our reference standards. The first column on the left is pure Eurycomanone from Chromadex, with a known concentration. The one on the right is the botanical reference material standard, which is also from Chromadex. Since the amount of eurycomanone in the leftmost lane is a known concentration, we can use that as our reference for the other samples. This is how we can quantify Eurycomanone in other samples accurately. As you can see, through capillary action, Eurycomanone made it up to Rf 0.65. When we visualize our TLC plate at 254nm, the entire plate fluoresces, hence the bright green color. At 254nm, Eurycomanone however does NOT fluoresce, and thus it shows up as a dark band. You can see this dark band in most of the samples we tested, indicating the presence of Eurycomanone.
As you can see in our own 2% and 10% Eurycomanone extracts, the band with Rf value 0.65 are quite dark, and you can see that the 10% Eurycomanone Tongkat Ali extract is slightly darker than the 2% Eurycomanone Tongkat Ali extract. These bands are how we identify specific compounds in the extracts. We’ll get to how we quantify the exact amounts of Eurycomanone via HPTLC in just a second, but let’s look at the plate that was exposed to a wavelength of 366nm first:

Fluorescence at 366nm:
At 366nm, we see the reverse of the TLC plate that was visualized at 254nm. On this plate, only the compounds of interest fluoresce, and thus they show up as colorful bands on a dark background. As you can see, there is a band that fluoresces right around Rf value 0.65 on this plate as well. However, since we are using a different wavelength of light, and given the fact that Eurycomanone prevents the fluorescence, this is not actually Eurycomanone. You can see how the Eurycomanone reference standard in the leftmost lane doesn’t fluoresce at this wavelength.
This is a sure indication that the band we are seeing in the Rf 0.65 region on the 366nm plate is something other than Eurycomanone. According to our research, this is likely a flavone that has yet to be elucidated in Tongkat Ali. This is based on the fact that it is fluorescing at 366nm and has an Rf value of 0.65. The interesting thing here is that two different compounds, due to similar polarities, both ended up at around Rf value 0.65. However, if we only visualized the plate at 254nm, then we would have only seen Eurycomanone and not the other flavone compound.
Understanding Different Compounds:
If we revisit our 1 mile race example that we discussed earlier, you and your experienced running friend both made it to the one mile mark in 9 minutes. This is easy to visualize, as we can visually see two different people at the 1 mile mark. In the case of HPTLC it is a little bit more complex, but by using different wavelengths of light, we can visualize two different compounds with the same Rf values. This is because different molecules will respond differently to various wavelengths of light.
This is why it is oftentimes important to run a HPTLC test at different wavelengths, rather than just running it at one wavelength of light, as we may miss some potentially interesting compounds! So in this analogy, viewing race positions from one angle might allow an observer to see you standing at the one mile mark of the race, where looking at the positions from another angle allows them to see your experienced friend at the same one mile mark. Both you and your friend are standing at the same mark, just like Eurycomanone and this flavone are at the same Rf of 0.65 on the plate.
Viewing them differently allows you to see the two things at the same place. So how can we empirically show this? We have to get further into the data. Take a look what we see when we zoom into the range of Rf 0.645.

Peak Analysis:
You can see that we see a couple distinct peaks close to the Rf 0.65 region when we get further into the data. The peak that the red arrow is pointing at is Eurycomanone. The peak that the blue arrow is pointing to is the suspected flavone compound. Why do we think the peak by the blue arrow is a flavone? Benzene usually absorbs around 280nm, which is about where that peak is located. Flavones contain multiple benzene rings. So we are assuming that there is a flavone that is yet to be elucidated in Tongkat Ali that just happens to fall close to the same Rf value as Eurycomanone.
If we only visually looked at the plates, we would not be able to tell the difference between the bands. However, our HPTLC software allows us to really get an accurate view of each band, and make determinations based on that data. That data explains why we see a band around the Rf 0.65 mark in both the 254nm and 366nm plates, even though Eurycomanone itself only shows up on the 254nm plate. You can see how the devil is in the details here. If you do not do a thorough job with your method development and validations, you can misinterpret or miss crucial factors in identifying and quantifying specific compounds.
Comparison of Extracts:
Another interesting thing to note here is that on the 366nm TLC plate, we see a stronger fluorescence at around Rf value 0.65 for the 2% Eurycomanone Tongkat Ali extract than we see for the 10% Eurycomanone Tongkat Ali extract. In fact, there appears to be more fluorescence overall at 366nm for the 2% Eurycomanone Tongkat Ali extract than for the 10% Eurycomanone Tongkat Ali extract. The most likely explanation for this is that the 2% Eurycomanone Tongkat Ali extract is a more “full spectrum” extract. This means that it contains a larger percentage of the other compounds in Tongkat Ali besides Eurycomanone. Oftentimes when we are aiming for a high standardization of one specific compound, in this case Eurycomanone, it is at the expense of the other compounds in a plant.
This means that the 10% Eurycomanone Tongkat Ali extract likely has a more focused effect that is more representative of pure Eurycomaone, whereas the 2% Eurycomanone Tongkat Ali extract is likely more representative of the whole root material. Overall, this results in the character of effects being different between the 2% and 10% Eurycomanone Tongkat Ali extracts. It is not simply the case that the 10% Eurycomanone Tongkat Ali extract is just 5 times more potent than the 2% Eurycomanone Tongkat Ali extract. Our goal was to maintain the ratios of the raw root as much as we could, and we have done a very good job of that. The 10% extract keeps many of the compounds you would find in the raw root.

Analyzing Extract Composition:
Lane 7 is the botanical reference material of raw Tongkat Ali root from Chromadex. Lanes 8-11 are increasing concentrations of our 10% extract. Lanes 12-15 are increasing concentrations of our 2% extract. As you can see, we do a very good job of keeping the various compounds in the raw root intact. However, you can see that the bands in the 2% fluoresce differently, and are at different ratios/concentrations than the 10%. As we concentrate Eurycomanone, we inevitably change the ratios of the final product.
This is also why we find more of that flavone compound at Rf 0.65 in our 2% extract, even though it has less Eurycomanone. This is one way to visualize why our 2% extract might feel different than our 10% extract, even if you tried to just increase the dose. You can see how we can use our analytical tools to get a very detailed view into our products, and exactly which compounds are in them.
Quantifying Compound Percentage:
It’s pretty clear that after seeing all this, getting exact numbers is definitely a complex science. Determining exact percentages of a given compound like Eurycomanone based solely on visual analysis is obviously not doable. Thus, these plates only allow us to visualize qualitatively that Eurycomanone is present, but it does not allow us to quantify exactly how much Eurycomanone is present. The peaks are analyzed for Absorbance Units (AU), and this is what allows us to quantify exact percentages. Fair warning, we are about to discuss a fair amount of math! Below is an example of this for sample SSF-266 which corresponds to competitor number 1 in our table above.

As you can see in the chromatogram above, peak number 4 is Eurycomanone. This matches the Rf value found in the Eurycomanone reference standard. We can then take this AU value and plug it into a calibration curve.

This calibration curves gets created by plotting the concentration of the reference standard against its AU value, then regressing the data. This can then be used to accurately quantitate subsequent samples. If your methods and measurements are valid, they will fall on the line connecting the various reference standard measurements. By using the calibration curve above, we can calculate the amount of Eurycomanone present in each sample. Check out the table below for our results for sample SSF-266 (competitor 1):

This particular sample was created by dissolving 0.5116 grams of Tongkat Ali extract into 50 mL of our solvent. Using these data, we can calculate a dilution factor:
50 mL 0.5116 g = 97.733
Now we can determine how much Eurycomanone a pure, undiluted sample would contain:
53.70 μg/mL x 97.733 = 5248.262 μg/mL
We now need to convert this value into a percentage by mass. To do this, we can assume that 1 mL is equal to 1 gram, as is standard for diluting solids into liquids. With this in mind, we can convert our microgram per milliliter value into a gram per gram value. Below is the math used to get to this point:
5248.101 μg/mL 1000 μg/mg = 5.248101 mg/g
5.248101 mg/g 1000 = 0.005248101 g/g
Now that we have the concentration expressed in a Eurycomanone per total sample mass amount, we can easily convert it into a percentage by mass:
0.005248101 g/g x 100 = 0.5248101%
After running through these calculations, we can determine with a very high level of accuracy that sample SSF-266 contained 0.5248101% Eurycomanone, which rounds to 0.52%. While that may have gone over many people’s heads, we felt it was necessary to really get into the details behind the numbers. The amount of method development and validation work we do in the background would surprise many people. We want our numbers to be accurate. We want people to trust that when we make a claim, that claim is backed up by valid scientific proof.
We feel that inaccurate or misleading numbers are worse than no numbers at all. Consumers trust science. However, when science is used improperly, or worse… to purposely mislead, it erodes people’s trust in valid scientific evidence. That is extremely dangerous. This is why we always ensure we are doing everything scientifically necessary to validate our chemistry, measurements, and calculations. You can see from our calibration curve that all our measurements fall within expected parameters, and our method results in a linear response at varying concentrations. This is a positive confirmation of assay performance, and shows that all our results are within a valid analytical range.
LET’S TALK ABOUT TONGKAT ALI BENEFITS!
So now that we are on the same page about Tongkat Ali quality, let’s discuss what a high quality Tongkat Ali supplement can do for you! The rest of this blog will be split up into five sections, each corresponding to the benefits we listed earlier in the blog. If you would like to learn more about one specific Tongkat Ali benefit, we would recommend jumping to that section. However, if you would like to become a Tongkat Ali expert, we would recommend reading about all of the amazing Tongkat Ali benefits!
✔ BEST COMBINATION OF AFFORDABILITY AND CONVENIENCE*
✔ MAY HELP PROMOTE BALANCED TESTOSTERONE LEVELS*
✔ MAY HELP PROMOTE EXERCISE PERFORMANCE*
✔ MAY HELP PROMOTE A POSITIVE MOOD*
✔ MAY HELP PROMOTE METABOLIC FUNCTION*
✔ MAY HELP PROMOTE BONE HEALTH*
✔ THE MOST POTENT TONGKAT ALI EXTRACT AVAILABLE FROM NOO-TROPICS.EU*
✔ MAY HELP PROMOTE BALANCED TESTOSTERONE LEVELS*
✔ MAY HELP PROMOTE EXERCISE PERFORMANCE*
✔ MAY HELP PROMOTE A POSITIVE MOOD*
✔ MAY HELP PROMOTE METABOLIC FUNCTION*
✔ MAY HELP PROMOTE BONE HEALTH*
✔ BEST FOR FLEXIBLE DOSING*
✔ MAY HELP PROMOTE BALANCED TESTOSTERONE LEVELS*
✔ MAY HELP PROMOTE EXERCISE PERFORMANCE*
✔ MAY HELP PROMOTE A POSITIVE MOOD*
✔ MAY HELP PROMOTE METABOLIC FUNCTION*
✔ MAY HELP PROMOTE BONE HEALTH*
TONGKAT ALI EXTRACT MAY HELP PROMOTE BALANCED TESTOSTERONE LEVELS*
One of the most popular uses for Tongkat Ali, is for helping to promote balanced testosterone levels. Tongkat Ali, and more specifically its Eurycomanone content, may help support both free testosterone and total testosterone levels. Tongkat Ali achieves this through indirect pathways, which actually focuses on regulating Estrogen levels. In men, Testosterone is mainly synthesized in the testes by specialized cells called Leydig cells.
These Leydig cells exist in high numbers in the testes in men, but to a lesser degree also exist in ovaries in women. In order for Leydig cells to produce Testosterone, they need to receive a signal from both the hypothalamus and pituitary gland. First, the hypothalamus initiates the signal. This produces GnRH. GnRH then acts on the pituitary gland, which causes a release of LH. LH then signals for the testes to start synthesizing Testosterone. Once Testosterone has been produced, it can also be turned into Estradiol by an enzyme called Aromatase. Estradiol can then regulate the activity of the hypothalamus and pituitary gland, which then slows down Testosterone synthesis. You can see this process illustrated in the image below:

This is where Tongkat Ali comes in, and can help promote testosterone synthesis by regulating estrogenic activity. Eurycomanone appears to be able to modulate the activity of Estradiol receptors that are located on the hypothalamus and pituitary gland. Through this action, Eurycomanone may help support and promote overall testosterone synthesis!
TONGKAT ALI EXTACT MAY HELP PROMOTE EXERCISE PERFORMANCE*
In the section above we discussed how a Tongkat Ali supplement may help promote testosterone synthesis through its Eurycomanone content. Now, as many of you may already know, testosterone plays a big role in supporting muscle mass and promoting muscular strength. Thus, by promoting testosterone synthesis, Tongkat Ali may help promote muscle strength and exercise performance!
A recent study found that when a Tongkat Ali supplement was added to an 8 week long resistance training program, it promoted peak output power, isokinetic lower limb power and relative anaerobic power of the athletes. The same resistance training program without Tongkat Ali supplementation, only helped to promote isokinetic lower limb power and relative anaerobic power of the athletes.
Furthermore, Tongkat Ali was also shown to help promote fat loss. This could indicate that taking a Tongkat Ali supplement alongside a training program, could help promote physical strength whilst also supporting fat loss!
TONGKAT ALI EXTRACT MAY HELP PROMOTE A POSITIVE MOOD
Tongkat Ali has been shown to be quite good at helping to support stress management. In this sense, Tongkat Ali is actually quite similar to many adaptogens like Ashwagandha, which also helps regulate the stress hormone cortisol.
A study on 32 men and 31 women, found that supplementation with Tongkat Ali could help promote lower levels of tension by 11%, lower levels of anger by 12% and lower levels of confusion by 15%. The researchers found that these effects were likely caused by the Tongkat Ali supplement promoting lower levels of the stress hormone cortisol, and higher levels of testosterone.
Furthermore, testosterone is also highly involved in mood, and this is especially the case for men. Anecdotally, many people who supplement with Tongkat Ali, report feeling more confident in their day to day life. They also often report feeling more driven and motivated to get work done!
TONGKAT ALI EXTRACT MAY HELP PROMOTE METABOLIC FUNCTION*
Tongkat Ali also appears to share some effects with supplements such as Berberine and Shiitake mushroom. In particular, Tongkat Ali is a great supplement for helping to promote metabolic function. Tongkat Ali has been shown in various studies to help support blood glucose levels that are already in a healthy range. Tongkat Ali helps promote pancreatic islets function by promoting beta-cell formation in addition to promoting pancreatic and duodenal homeobox 1 expression. These are quite complex concepts to break down in this blog, but the overall effects of promoting pancreatic islets function, is that our bodies become better equipped at distributing and dealing with glucose in the body!
Furthermore, it also appears that Tongkat Ali may help support fat metabolism! In combination with the blood glucose regulating effects, this may make Tongkat Ali a great choice for those looking for a supplement that may help support weight loss.
TONGKAT ALI EXTRACT MAY HELP PROMOTE BONE HEALTH*
In addition to all of the Tongkat Ali benefits we have discussed up until this point, we left one of the best and likely the least well known Tongkat Ali benefit for last! Tongkat Ali has a remarkable effect on helping to both promote and support bone health. Testosterone plays a very important role in supporting bone health, especially in men. As men age, and their Testosterone levels start to reduce, their bone health also tends to trend downwards. It has been shown that promoting testosterone levels can help support bone health in situations where we see lower levels of testosterone. Thus, it is no surprise that Tongkat Ali may help promote bone health, as it appears to do a great job at promoting testosterone levels.
However, what makes Tongkat Ali very unique, is that it appears to also promote bone health independently from testosterone. This means that a Tongkat Ali supplement may both help promote bone health through supporting testosterone levels, and additional mechanisms such as promoting various mitogenic protein biomarkers. This makes Tongkat Ali a fantastic supplement for those looking to support their bone health!
WHO SHOULD TAKE A TONGKAT ALI SUPPLEMENT?
Tongkat Ali can be taken by both men and women, since it is merely promoting the synthesis of testosterone and not providing exogenous testosterone. This will allow both men and women to enjoy Tongkat Ali benefits! That being said however, Tongkat Ali will likely have a more pronounced effect in men.
Also read our blog on St John’s Wort